


Just under 29 million Americans lacked health insurance in 2017, according to data released Wednesday and Thursday by the U.S. Census Bureau.
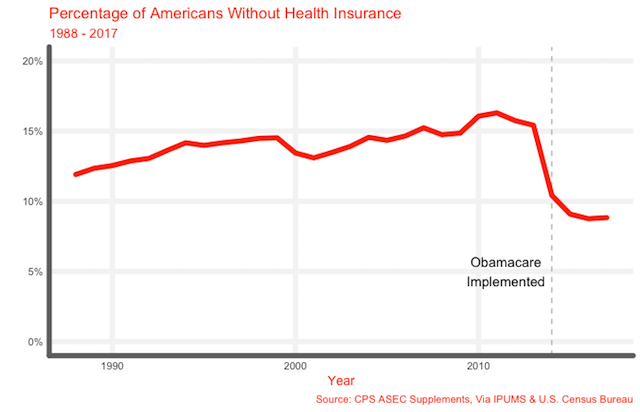
That figure represents 8.8 percent of the population—essentially unchanged from 2016—and a three percent decline from when the Census Bureau began tracking the uninsured rate 30 years ago.
The number of uninsured people fell notably after implementation of the Affordable Care Act in 2014, a trend due largely to Medicaid expansion and the purchase of individual insurance mandated by Obamacare and facilitated by the exchanges it set up. However, the drop appears to have leveled off, leaving many still without insurance.
Certain groups are predictably more likely to be insured than others. Children and the elderly are seven and eleven percentage points more likely to have insurance than Americans age 19 to 64, thanks primarily to CHIP and Medicare. Access to public insurance also explains why the disabled are more likely to be insured than the non-disabled, with rates of 91.2 and 87.5 percent, respectively. By contrast, adults age 26 to 34 were least likely to have insurance, presumably because many are transitioning off of their parents' health insurance.
The widespread availability of social insurance programs masks the ways, however, that social factors still play a key role in access to insurance. As many obtain healthcare through their spouse's employer, married Americans are more likely than their unmarried peers to be insured: 90.9 percent versus 84 percent. The least likely to be insured are in fact the recently separated, followed by those who are widowed or divorced.
Similarly, work predicts access. Ninety percent of Americans employed full-time, year-round had insurance, compared to 85 percent of those who were unemployed at some point in 2017. Those with the highest incomes were most likely to be insured: 96 percent of Americans making more than $125,000 per year had insurance, compared to 86 percent of those making less than $25,000.
Education is also tied to insurance, likely because of its relationship to income. Among adults 26 to 64, 93 percent of those with college degrees, and 96 percent of those with advanced degrees, had insurance. By contrast, 26 percent of Americans without a high school degree also were without health insurance.
As the Census Bureau noted previously, race and ethnicity are strongly tied to access to wealth. Health insurance is no exception, with Hispanic and Black Americans lagging behind their White and Asian peers in terms of uninsured rate.
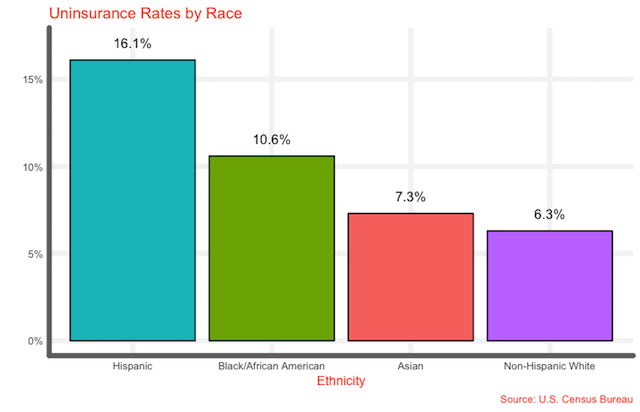
The high number of uninsured Hispanic people in the United States is likely thanks to another trend the Census Bureau noted: the low prevalence of insurance among residents who are not U.S. citizens. Among the population the Bureau polled, 92 percent of native-born and naturalized-citizen respondents had insurance, compared to 74 percent of non-citizens.
The Bureau also provided information on which states are most and least insured. Those in the south were least well-covered, especially Texas, Florida, and Oklahoma. By contrast, much of the northeast and Midwest were well-covered.
The Bureau explicitly tied the state-by-state distribution of insurance to whether or not states accepted Medicaid expansion under ObamaCare; as of May of this year, 32 states had, while 18 had not.